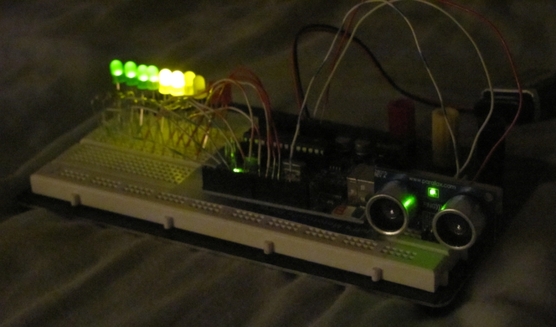
Ardie's new eye getting probed for readings.
Introduction
Howdy All,
I know it's been quite awhile since I updated the blog here. Believe it or not, I've actually been pretty busy. That's why I haven't been able to work on many projects or get much blog content up lately. However, tonight I am going to rectify that with a quick description about some of the testing I am doing for my next upgrade for Ardie.
Basically I want to give Ardie a set of 'sight' sensors to help him avoid obstacles. While that sensor suite could, one day, include a full set of cameras, today is not that day. Today, instead, I am going to be testing some ultrasonic rangefinders for Ardie to use in place of actual eyes. Rangefinders work in the same manner that a bat or a dolphin's echolocation does. They bounce a super-high-pitched sound wave off of nearby objects and then process the reflected wave to determine how far away the object is. The result is returned as a digital step wave
Notes on the Sensor
First and foremost I need to talk about the sensors that I am using. I purchased two of these Parallax rangefinders at my local Radio Shack for use in this upgrade. There is a lot that can be said about these sensors, including a lot of calibration and test data that can be discussed. Luckily for me, Parallax has already gone through the trouble of documenting most of the specifics for these sensors. A document of the most important data relating to these products can be downloaded here. I highly suggest reading through that document, or at least skimming it if you intend to use these sensors for your own projects. Personally, I am only going to touch on the data most relevant to my project.
Basically these rangefinders, or ping sensors, work by sending out a sound wave. The sound wave then bounces off of a nearby object and returns back to the rangefinder. Based on that soundwave response, or "ping," the rangefinder calculates the distance to the nearby object. If the object is further away, the rangefinder sends a long digital step wave out its "SIG" pin. If the object is close, a digital step wave with the same amplitude is returned, but it has a shorter wavelength. The exact length of the returned step wave (measured in time) depends on the length of the ping pulse shot out by the sensor in the first place. This relationship is depicted below in Figure 1 (image is the property of Parallax).
Basically these rangefinders, or ping sensors, work by sending out a sound wave. The sound wave then bounces off of a nearby object and returns back to the rangefinder. Based on that soundwave response, or "ping," the rangefinder calculates the distance to the nearby object. If the object is further away, the rangefinder sends a long digital step wave out its "SIG" pin. If the object is close, a digital step wave with the same amplitude is returned, but it has a shorter wavelength. The exact length of the returned step wave (measured in time) depends on the length of the ping pulse shot out by the sensor in the first place. This relationship is depicted below in Figure 1 (image is the property of Parallax).
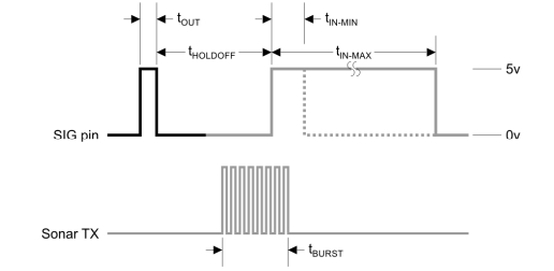
Figure 1: The return wave's length, depicted to vary between t_in-min and t_in-max, is a function of the output pulse, depicted as t_out. This image was provided via the PDF from Parallax linked to above.
In order to properly use the data returned by the sensor, we need to have some means of scaling t_in-min and t_in-max. Luckily, Parallax has already provided us with that information for a pulse output burst of 5 us (us = microsecondes for the purpose of this blog entry. 1x10^-6 us = 1 regular second), These values are depicted in the Parallax provided Table 1 below.
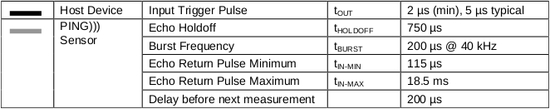
Table 1: Minimum and maximum return wave pulse lengths for an output pulse of 5 us. Image provided by Parallax in PDF linked to above.
Now we know that the sensor should return a pulse length somewhere between 115 us and 18.5 ms (note, this is equivalent to 18,500 us). We must note that this numerical value is not returned directly via the signal pin, as would be the case for an analog sensor. Rather we must configure the our signal pin to switch from an output mode (to generate the 5 us t_out burst) to an input mode. We can then use a while loop to add 1 us to a time counter variable for every tick through the loop (Arduino keeps time in microseconds) until the input on the signal pin switches from high to low. By doing so, we will effectively measure the pulse width of the high amplitude return signal. The relevant bits of the source code for performing this reading are shown in the preformatted text box below.
   // Set the signal pin to perform a pulse output wave defined as 2 us off,
   // 5 us on, and then immediately switched off again.
   digitalWrite(RangePin, LOW);
   delayMicroseconds(2);
   digitalWrite(RangePin, HIGH);
   delayMicroseconds(5);
   digitalWrite(RangePin, LOW);

   // Switch the signal pin over to the INPUT mode and read the signal to
   // the Value variable
   pinMode(RangePin, INPUT);
   Value = digitalRead(RangePin);

   // Continue reading the input RangePin until a High value is detected
   while(Value == LOW){
     Value = digitalRead(RangePin);
   }

   // Once the RangePin starts returning a High value, start counting the
   // number of microseconds until the signal stops.
   while(Value == HIGH){
     Value = digitalRead(RangePin);
     TimeOn = TimeOn + 1;
   }
Now that we know how to read the input to the rangefinder, we need to figure out what to do with it. That's where my previous analog sensor testbed, or "Volume Board," will come in handy.
Reconfiguring the Testbed
As some of you will recall, I already assembled a sensor configuration and testbed platform as one of my previous projects. If you have not read my blog entry regarding the configuration of the "Volume Board v1.0," then I suggest you do now, as it was recycled (yay! I've gone green!) for the purposes of this test.
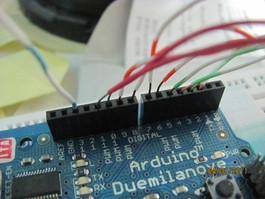
Figure 2: Digital pins 2 through 11 were used as
output pins for the LED display. Each wire depicted
corresponds to a display LED on the breadboad.
Digital pin 13 was used for the I/O interface to the
SIG pin on the rangefinder. The white and blue wire
corresponds to this connection.
output pins for the LED display. Each wire depicted
corresponds to a display LED on the breadboad.
Digital pin 13 was used for the I/O interface to the
SIG pin on the rangefinder. The white and blue wire
corresponds to this connection.
As you may also recall, that testbed was configured to process an analog input voltage via the analog pins. This is not the appropriate configuration for reading a digital step wave. Rather, the input needs to be read from one of the digital pins. I decided to use pin 13 (as is reflected in the source code snippet pasted above) because it is on the other side of the Arduino board from my 10 LED pines.
I also reconfigured the LED pins I am using for output. Rather than streaming my output along pins 0 through 9, I used digital pins 2 through 11. I had to do this because pins 0 and 1 are used when transmitting and receiving data across the serial bus attached to the computer. Since I wanted the serial output enabled for this test I needed to use pins other than 0 and 1 for my first two LED outputs. Thus, I moved every LED wire over by two slots. This final configuration is depicted, albeit sloppily, in Figure 2.
I also reconfigured the LED pins I am using for output. Rather than streaming my output along pins 0 through 9, I used digital pins 2 through 11. I had to do this because pins 0 and 1 are used when transmitting and receiving data across the serial bus attached to the computer. Since I wanted the serial output enabled for this test I needed to use pins other than 0 and 1 for my first two LED outputs. Thus, I moved every LED wire over by two slots. This final configuration is depicted, albeit sloppily, in Figure 2.
The full source code for this testbed, including a well-commented discussion of the pins used on the board, can be found at the end of this blog.
Mapping the Readings
With the hardware configured appropriately, all that was left to do was to map the input pulse widths to a decent output display. In my original Volume Board project I mapped the analog input signal to ten evenly spaced voltage readings. This allowed me to light a single LED for each additional 102 units of analog input. I needed to come up with a similar interval mapping for this test.
The possible input values I could receive would vary between 115 us and 18,500 us according to Table 1 above. This left me with a 10 slot interval of (18500 - 115) / 10 ~= 1839 us. This was, therefore, the first interval mapping I tried. Essentially I lit 1 LED for every 1839 us measured on the input pin. Unfortunately, I didn't bother to scale my interval mapping against common sense. According the the Parallax specification document (PDF linked to above) this particular sensor has a maximum range of about 3 meters. Well I don't think my room is 3 meters across. Thus, calibrating my sensor for such a large distance was impractical. I discovered this when, originally, my sensor testbed would only light up two LED's for any given position of the testbed.
To fix this, I read some of the sensor input readings for various positions of my testbed and developed my own map scale. This time, I turned on one LED for every 200 us of input read. This allowed for a higher fidelity reading on the low end of the spectrum which was more important since the high end (of 18,500 us) was never really approached in practice. The final results of this 200 us mapping are depicted in the full source code. Video 1 a below shows the final test of one of my two ping sensors on the test bed.
Video 1: Here I am showcasing the final testbed configuration for the sensor. Notice how more LED's light up as my hand moves further from the sensor, but as my hand moves closer, some of the LED's dim.
Rambling into the Future
This test was a complete success. I completed my goals of scaling an ouptut based on the distance readings by both ping sensors (I plugged in the second sensor after taking the video). Most of the code I used for this project was shoplifted liberally from the Arduino user's guide on ultrasound sensors here. I need to note, however, that this was a very basic sensor test and I have a lot more design work to do before Ardie's final retrofit.
Basically, I need to do some math to determine a proper geometry for the sensor mounts on Ardie. I will be utilizing both ping sensors at once. I intend to use some fancy geometry and trigonometry to develop a control algorithm that scales both of Ardie's motor drives based on where objects are in front of him. If done right, Ardie should be able to navigate through a narrow sleuth or maze without running into anything.
One factor that needs to be accounted for is the view angle of the sensor. These sensors do not have a 180 degree forward sweep, as their effectiveness relies upon the reception of a reflected wave signal. If the return wave reflects in a direction that will not intercept the sensor, then the sensor will not obtain a reading. The PDF I linked to at the beignning of this blog contains some useful information about the viewing angles of these particular sensors. A sample of this data is depicted in Figure 3.
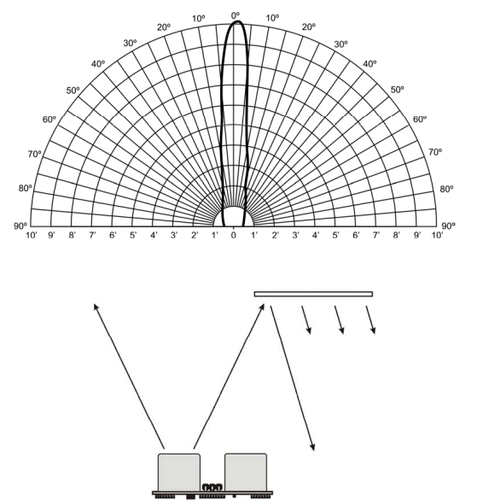
Figure 3: Perfectly flat surfaces will not necessarily reflect the output ping of the rangefinder back towards the sensor. As a result, the sensor only has an effective view field of ~10 degrees about the primary axis. The planned dual sensor configuration for Ardie should help expand this field somewhat. Image provided by Parallax via the PDF linked to at the beginning of this blog.
In order to design such an appropriate configuration I also need to learn a bit more about various distortion affects on the sensor readings such as doppler shift and the speed of sound in air. Some useful information regarding such ultrasound sensor noise sources can be found on the SensorWiki here.
In short, I still have a lot of design work to do before Ardie can "see" his environment. Thus, it might be a few blog entries until I showcase an updated version of Ardie. However, I will try to keep blogging "baby step" entries like this so that the entire design process can be documented and followed.
Until next time, then, good hacking, and great building!
Best of luck,
Brady C. Jackson
Sensor Bed Source Code
 /* Volume_Board_v1.0.pde
 Author: Brady C. Jackson
 Date: 09/25/2010
 Thanks to: http://sheepdogguides.com/arduino/FA1adc.htm
            http://www.ladyada.net/learn/arduino/lesson3.html
            http://www.arduino.cc/en/Tutorial/UltrasoundSensor

 Description: This sketch will by used to read the digital step input from an
   ultrasonic rangefinder and convert the signal into digital commands to
   pins 2 - 11 which are connected to LEDs. The sketch will, therefore,
   control a visual volume board.
 */

 int Value = 0;
 int TimeOn = 0;

 int RangePin=13;             // Primary RangeFinder Signal Pin

 const byte LED2=2;   // LED for least significant bit connected here
 const byte LED3=3;   // LED bit 1
 const byte LED4=4;   // LED bit 2
 const byte LED5=5;   // LED bit 3
 const byte LED6=6;   // LED bit 4
 const byte LED7=7;   // LED bit 5
 const byte LED8=8;   // LED bit 6
 const byte LED9=9;   // LED bit 7
 const byte LED10=10; // LED bit 8
 const byte LED11=11; // LED for most significant bit connected here

 void setup()       // Enable all LED pins for OUTPUT mode
 {

    pinMode(LED2,OUTPUT);
    pinMode(LED3,OUTPUT);
    pinMode(LED4,OUTPUT);
    pinMode(LED5,OUTPUT);
    pinMode(LED6,OUTPUT);
    pinMode(LED7,OUTPUT);
    pinMode(LED8,OUTPUT);
    pinMode(LED9,OUTPUT);
    pinMode(LED10,OUTPUT);
    pinMode(LED11,OUTPUT);

    //Enable Serial output to computer
    Serial.begin(9600);
 }

 void loop()
 {
   // Reset the Time_On and Value variables each loop.
   TimeOn = 0;
   Value = 0;

   pinMode(RangePin, OUTPUT); // Set up the signal pin as an output initially

   // Set the signal pin to perform a pulse output wave defined as 2 us off,
   // 5 us on, and then immediately switched off again.
   digitalWrite(RangePin, LOW);
   delayMicroseconds(2);
   digitalWrite(RangePin, HIGH);
   delayMicroseconds(5);
   digitalWrite(RangePin, LOW);

   // Switch the signal pin over to the INPUT mode and read the signal to
   // the Value variable
   pinMode(RangePin, INPUT);
   Value = digitalRead(RangePin);

   // Continue reading the input RangePin until a High value is detected
   while(Value == LOW){
     Value = digitalRead(RangePin);
   }

   // Once the RangePin starts returning a High value, start counting the
   // number of microseconds until the signal stops.
   while(Value == HIGH){
     Value = digitalRead(RangePin);
     TimeOn = TimeOn + 1;
   }

   // Turn all LEDs on the board off
   setLEDs(0,0,0,0,0,0,0,0,0,0);

   // Turn on 1 LED for each 200 us of time detected by the RangeFinder
   if (TimeOn>200)    setLEDs(0,0,0,0,0,0,0,0,0,1);
   if (TimeOn>400)    setLEDs(0,0,0,0,0,0,0,0,1,1);
   if (TimeOn>600)    setLEDs(0,0,0,0,0,0,0,1,1,1);
   if (TimeOn>800)    setLEDs(0,0,0,0,0,0,1,1,1,1);
   if (TimeOn>1000)   setLEDs(0,0,0,0,0,1,1,1,1,1);
   if (TimeOn>1200)   setLEDs(0,0,0,0,1,1,1,1,1,1);
   if (TimeOn>1400)   setLEDs(0,0,0,1,1,1,1,1,1,1);
   if (TimeOn>1600)   setLEDs(0,0,0,1,1,1,1,1,1,1);
   if (TimeOn>1800)   setLEDs(0,0,1,1,1,1,1,1,1,1);
   if (TimeOn>2000)   setLEDs(0,1,1,1,1,1,1,1,1,1);
   if (TimeOn>2400)   setLEDs(1,1,1,1,1,1,1,1,1,1);

   // Return all TimeOn values to the serial reader on the computer for
   // analysis and debugging
   Serial.print("Time On = ");
   Serial.print(TimeOn);
   Serial.print("\n");

   // Delay the time between readings by 100 microseconds for cleaner inputs
   delay(100);
 }

 /*
   Use single routine, setLEDs, to enable and disable all digital output pins
  based on 10 bit input
 */

 void setLEDs(byte bL9, byte bL8, byte bL7, byte bL6, byte bL5,
 byte bL4, byte bL3, byte bL2, byte bL1, byte bL0)
 {

    // Set up LED outputs such that a 0 in the given bit slot will
    // result in an off LED, but any other reading (1) will turn
    // the mapped LED on

    if (bL0==0) digitalWrite(LED2,LOW);
                else  digitalWrite(LED2,HIGH);
    if (bL1==0) digitalWrite(LED3,LOW);
                else  digitalWrite(LED3,HIGH);
    if (bL2==0) digitalWrite(LED4,LOW);
                else  digitalWrite(LED4,HIGH);
    if (bL3==0) digitalWrite(LED5,LOW);
                else  digitalWrite(LED5,HIGH);
    if (bL4==0) digitalWrite(LED6,LOW);
                else  digitalWrite(LED6,HIGH);
    if (bL5==0) digitalWrite(LED7,LOW);
                else  digitalWrite(LED7,HIGH);
    if (bL6==0) digitalWrite(LED8,LOW);
                else  digitalWrite(LED8,HIGH);
    if (bL7==0) digitalWrite(LED9,LOW);
                else  digitalWrite(LED9,HIGH);
    if (bL8==0) digitalWrite(LED10,LOW);
                else  digitalWrite(LED10,HIGH);
    if (bL9==0) digitalWrite(LED11,LOW);
                else  digitalWrite(LED11,HIGH);

 }
0 Comments
Your comment will be posted after it is approved.

 RSS Feed
